

Here in mind but not in body
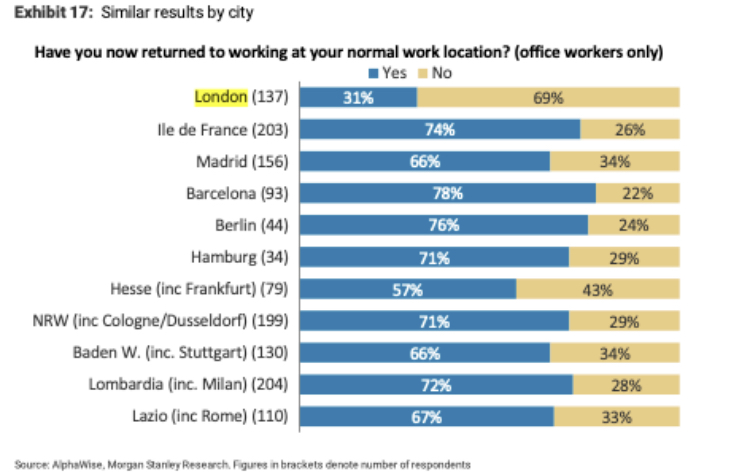
6 months of Covid and only 30% of UK workers are back at their desks in the offices, unlike 50% of French and 49% of German office teams. Some places like Dusseldorf managed to get 71% back at their desks (AlphaWise, Morgan Stanley survey July 2020). This is a sharp indication of how bad things will be for retail in each of the countries, as urban centres empty and shops remain open but customers-free as office workers are staying remote.
Massive retail lay-offs are inevitable in a few months if footfall in city centres does not recover. Cities and governments will have to take some timely, aggressive interventions. How can we, in our ivory towers of retail data community, help to point the money firehoses in the direction of the most needy, or at least to where averting disaster is still possible? AlphaWise tracker of ghost offices occupancy is certainly a useful, timely and welcome tool, just make it available to all please.
Human tracker turns saviour
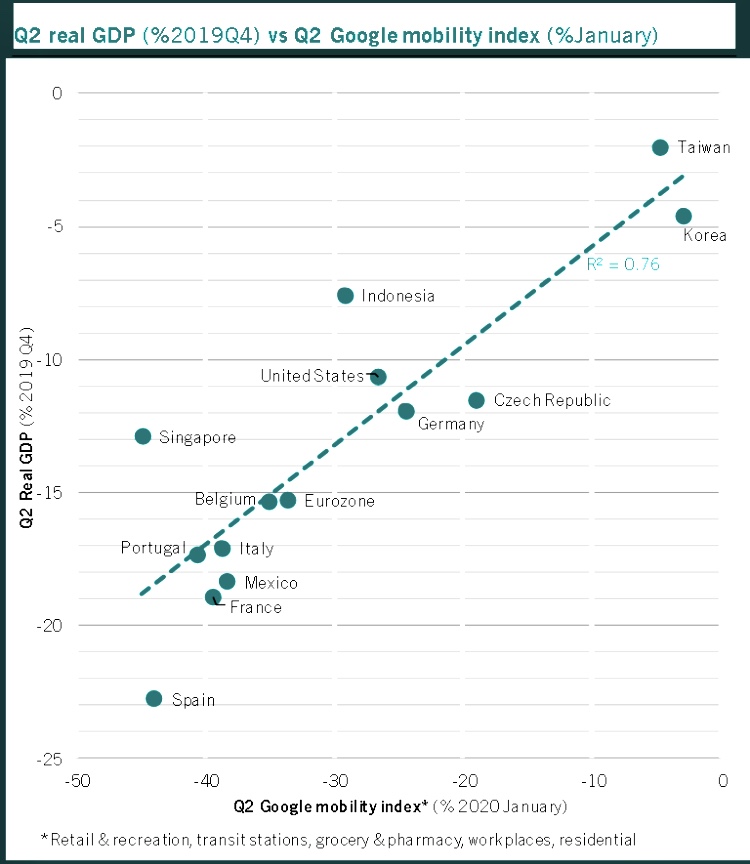
Footfall in city centres, around workplaces, transit zones and grocery shops is tracked by Google Mobility Index using data from our mobile phones. It provides a baseline from January 2020 and can be tracked against GDP movements quarter on quarter. In line with drop of footfall, Q2 drop in GDP is the sharpest in Spain (no tourists spending their cash on sangria and cerveza). Very small footfall drop was observed in Taiwan, and indeed, Taiwanese economy is the least affected so far, thx to early and effective government response. The graph reveals that slow coach governments, with poor Covid-fighting capabilities are having to work a lot harder on persuading their folk back to work, to shopping and to bars (also explains dunce ranking for UK economy, shrinking faster than you can say Dominic Cummings).
Google footfall feed is very granular, down to each borough and street level, which could help local governments to respond and help in struggling areas. If only Google Index was available as open data source, it would be even better (DM if you know anyone there as this is too good and too useful to be locked up in Google’s bottomless data vaults). For now, it is Stringfellows’ style, “watch but don’t touch”.
Is your High Street ok today?
Until we can get Google to play nicely and share Mobility Index, your second best source of retail data for near real-time snapshot on what is going on around your High Street from Mastercard/VocaLink. Shared now freely with London CTO Theo Blackwell, with data from Singapore and a few other Smart Cities, it provides a picture drawn from travel/tube/bus data, payments on the High Street, including time of payments, giving a an accurate day flow on how local High Street, or your retail area area is recovering. Miguel Gamino, lead at Mastercard/City Possible provides “Recovery” insights that show spending on retail pinned down to each neighbourhood.
Used by London Mayor’s team to direct aid where is needed, this source of data is of significant value. Of course, was London capable of running it’s own payment platform, as we always advocated, it would generate the same data within its own capabilities, without having to wait for Mastercard good will. CTO would know what is London’s baseline spend and get alerts when an area falls into ‘red zone’. Cities’ own payment platforms, providing real time data and retaining payment processing fee is something that should be a must, not an option. London Coin anyone?

Location location location
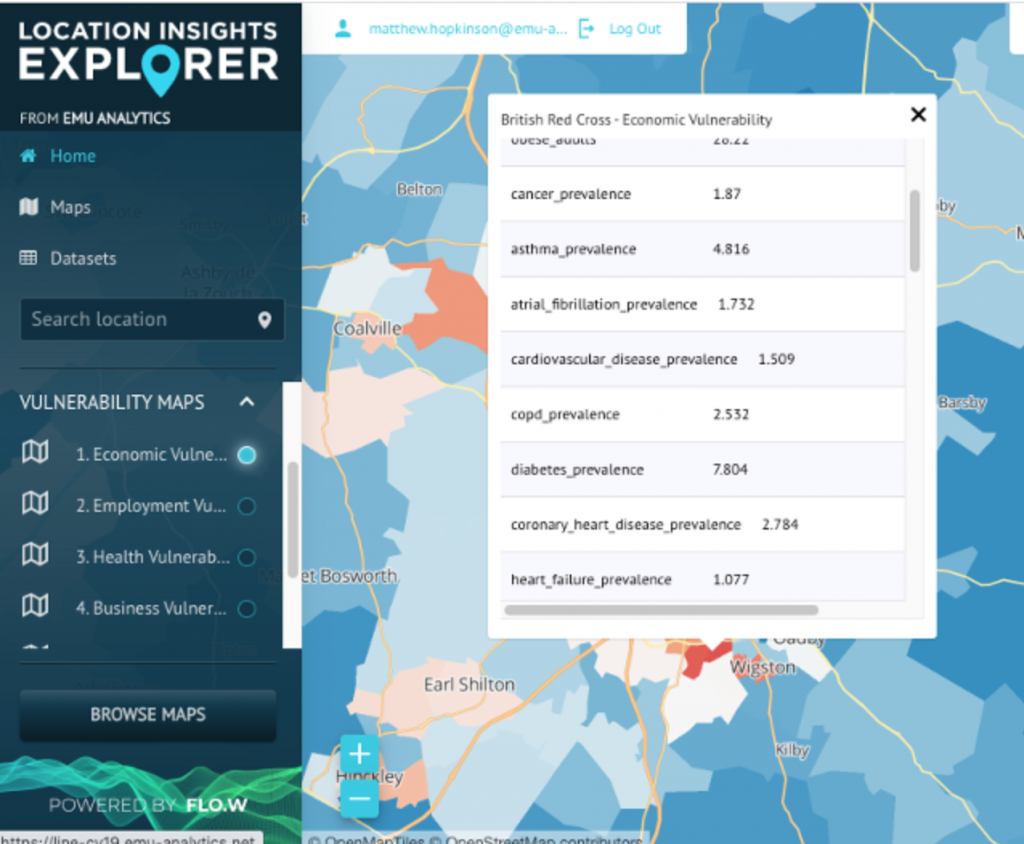
A picture tells a thousand words and a snapshot of ‘before’ and ‘after’ of your town, showing impact (or lack of) with easing of lockdown can be revealing. Emu Analytics, leading supplier of data for towns can show which areas are vulnerable if economic downturn accelerates. Housing Benefit, Universal Credit count, Consumer Vulnerability/Health combined with Mortgage lending, British Red Cross data and Covid Job Retention Scheme give a detailed ‘vulnerability index”. Local councils can subscribe and respond quickly before the unemployment increases beyond recovery. Emu Index is available for towns for no charge till the end of 2020, so do get in touch if you think your town will need a helping hand.
Turnover or die
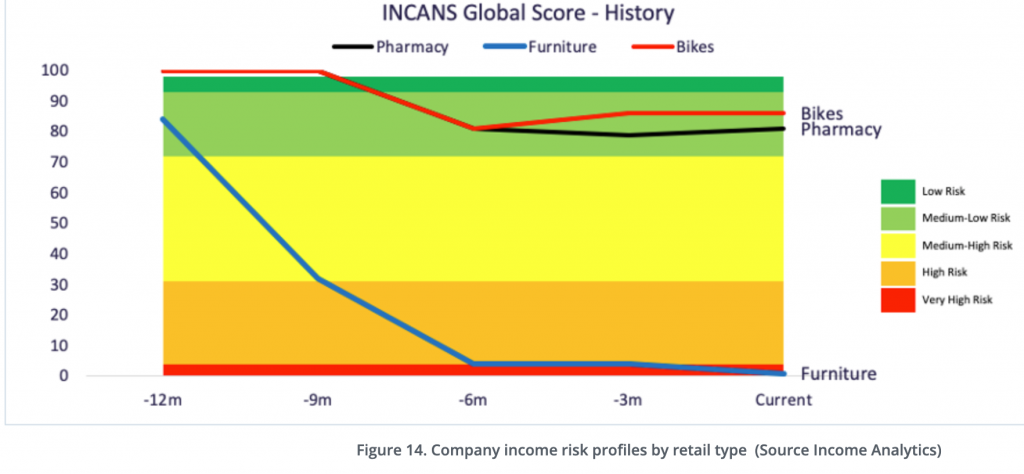
Towns in UK, US and European countries own an awful lot of properties, currently at a huge risk from losing their retailers and hospitality tenants. Many of those contracts are already in default, or stuck in CVA. It is not a pretty picture, as councils rely on this rental income to fund adult social care and local services. To get some visibility of the state of their tenants and engage early in a workable rescue plan, towns need access to Tenant Risk Index (sourced by Income Analytics). This economic health assessment of where the tenant’s own profitability sits and their survival chances will be a must-have when the new world of turnover rents descends upon us all. One thing is certain, in the world of constant change (and not for the better), timely data and helpful visualisation might just save us.
Into sentiment score
Finally, if you need a private Track and Trace app for your community tennis club, bowling alley or a gym, here is a good solution based on QR code. No more writing down names on flimsy and not GDPR proof bits of paper!